Python3でmatplotlibを用いて、箱ひげ図を表示する方法をお伝えする。
Ubuntu14.04環境で動作することを確認している。
Ubuntu14.04環境で動作することを確認している。
一つ注意点として、日本語に対応させるために、ここでは「IPAexGothic」を用いている。
import matplotlib as mpl
import matplotlib.pyplot as plt
import random
# データの作成
uniform = []
gauss = []
for i in range(0, 10000):
uniform.append(random.uniform(50, 100))
gauss.append(random.gauss(75, 5))
data = [uniform, gauss]
# 日本語対応
mpl.rcParams['font.family'] = 'IPAexGothic'
fig = plt.figure()
ax = fig.add_subplot(111)
# データをセット
bp = ax.boxplot(data)
# 横軸のラベルの設定
ax.set_xticklabels(['一様分布', '正規分布'])
# グリッド線を表示
plt.grid()
# 横軸のラベルを設定
plt.xlabel('分布')
# 縦軸のラベルを設定
plt.ylabel('値')
# タイトルを設定
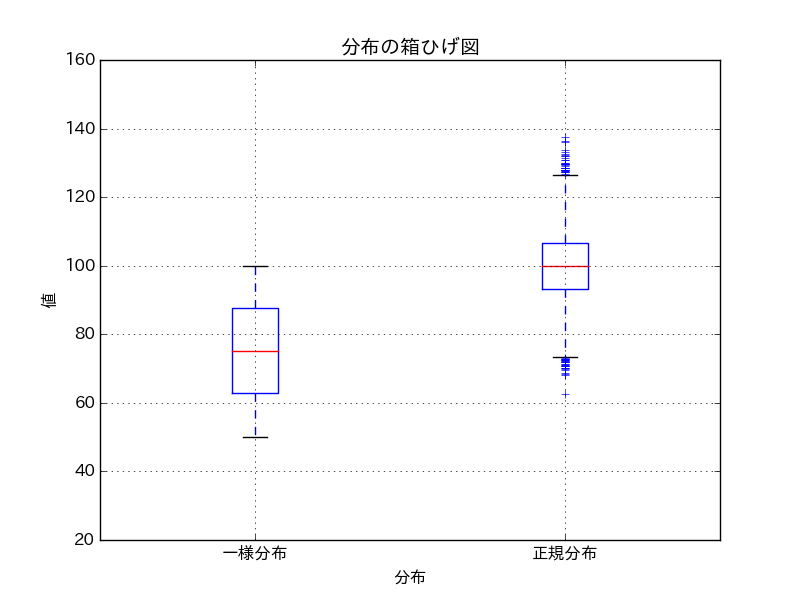
plt.title('分布の箱ひげ図')
# 縦軸の範囲を設定
plt.ylim([20,160])
# 箱ひげ図の表示
plt.show()
これを実行させると、次のグラフが表示される。