コンテンツへスキップ
トライフィールズ
データサイエンス – 統計解析・機械学習
メニュー
ホーム
サービス
事業概要
ブログ
サイトマップ
お問い合わせ
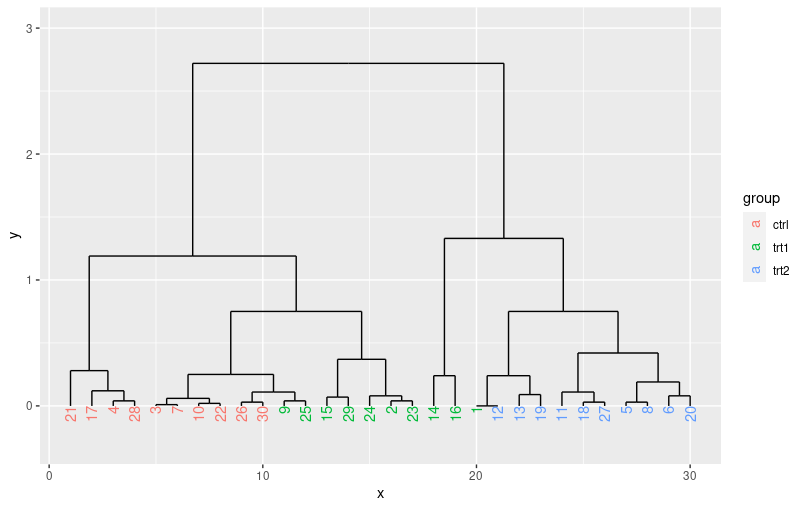
how-to-visualize-the-results-of-hierarchical-clustering-using-ggplot2-in-r-03
how-to-visualize-the-results-of-hierarchical-clustering-using-ggplot2-in-r-03
← 前へ
こちらもおすすめ
Journal of Statistical Software: Volume 110の記事一覧
R×forcats::fct_expand 因子水準を新規追加する
R応用 データフレームから欠損値を含む行を取得する方法